Welcome to our Knowledge Base
Tip: Start typing in the input box for immediate search results.
Reports
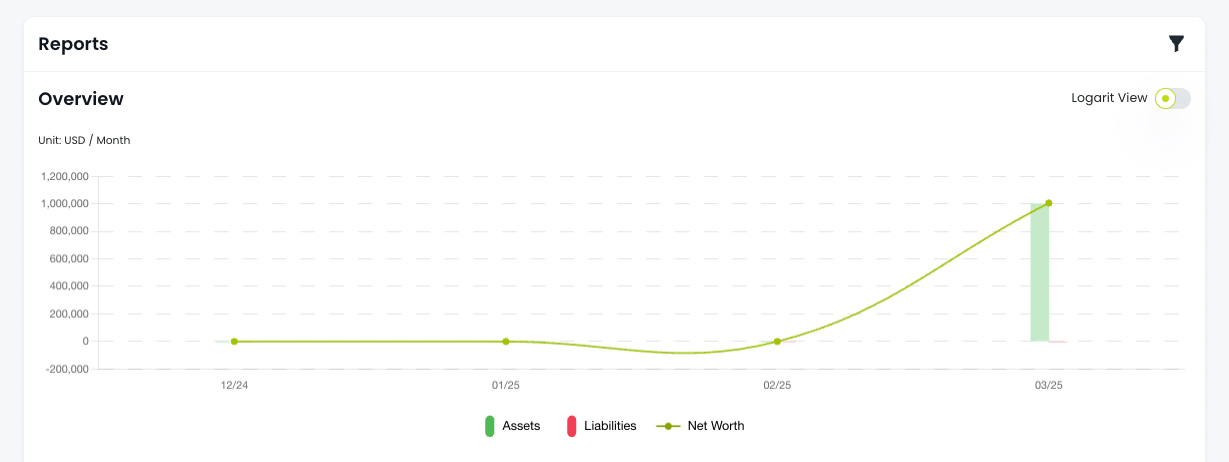
The Reports section provides a visual representation of your financial status. This gives you a quick snapshot of your overall financial health.
Overview of Report Screen
At the top of the screen, you will see a chart displaying your:
- Assets (total value of what you own)
- Liabilities (total debts and obligations)
- Net Worth (Assets minus Liabilities)
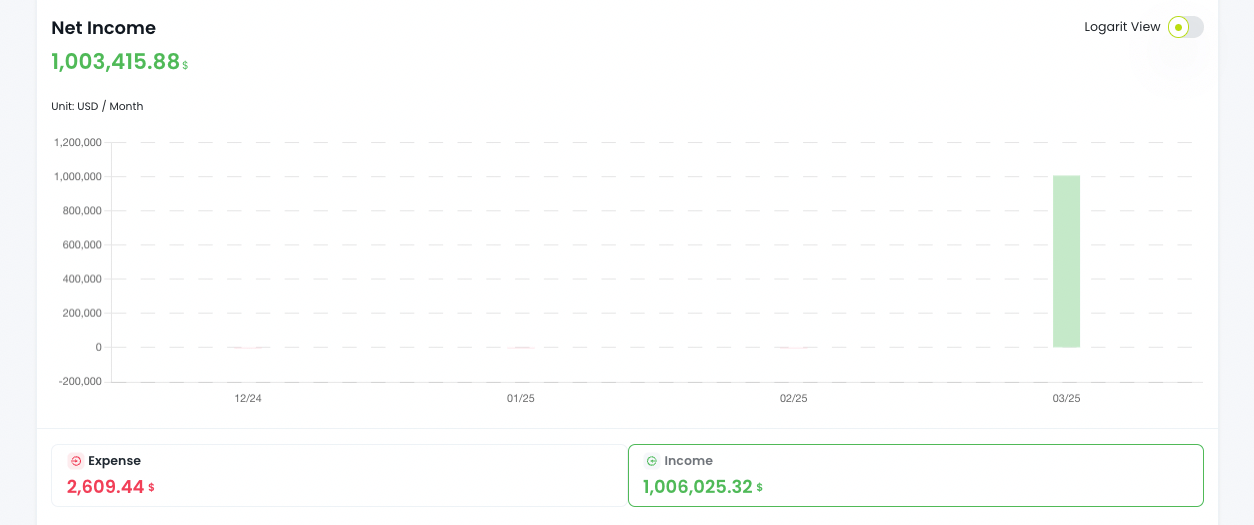
1. Viewing Your Net Income
Scroll down to view your Net Income displayed in another chart. This section breaks down:
- Income (money you earn)
- Expenses (money you spend)
By analyzing this chart, you can track how much you are earning versus spending over time.
2. Exploring Expense and Income Categories
To dive deeper into your financial details:
- Tap on the Expense or Income section in the Net Income chart.
- You will see a Categories List showing a breakdown of your income or expenses.
- Each category will display the total amount spent or earned within that category.
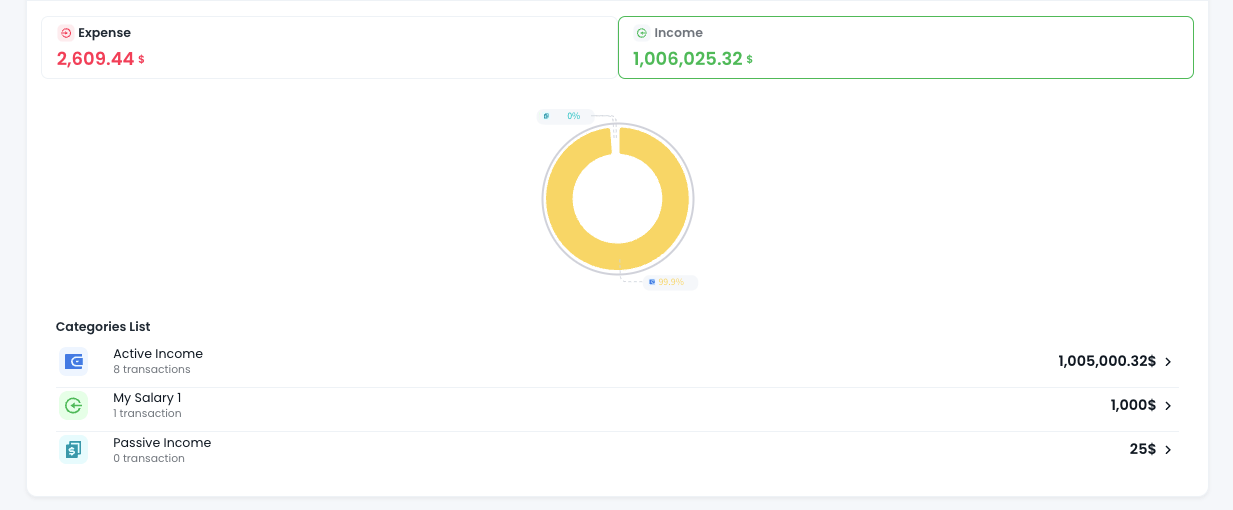
This feature helps you understand where your money is coming from and where it is going.
Customizing Your Reports with Filters
You can generate a custom financial report using the Filter feature:
- Tap the Filter icon located at the top right corner of the screen.
- You will see several filter options, including:
- Date Range: Select a specific time period.
- Accounts: Choose which bank accounts or cash accounts to include.
- Categories: Focus on specific income or expense categories.
- Tags: Filter transactions based on assigned tags.
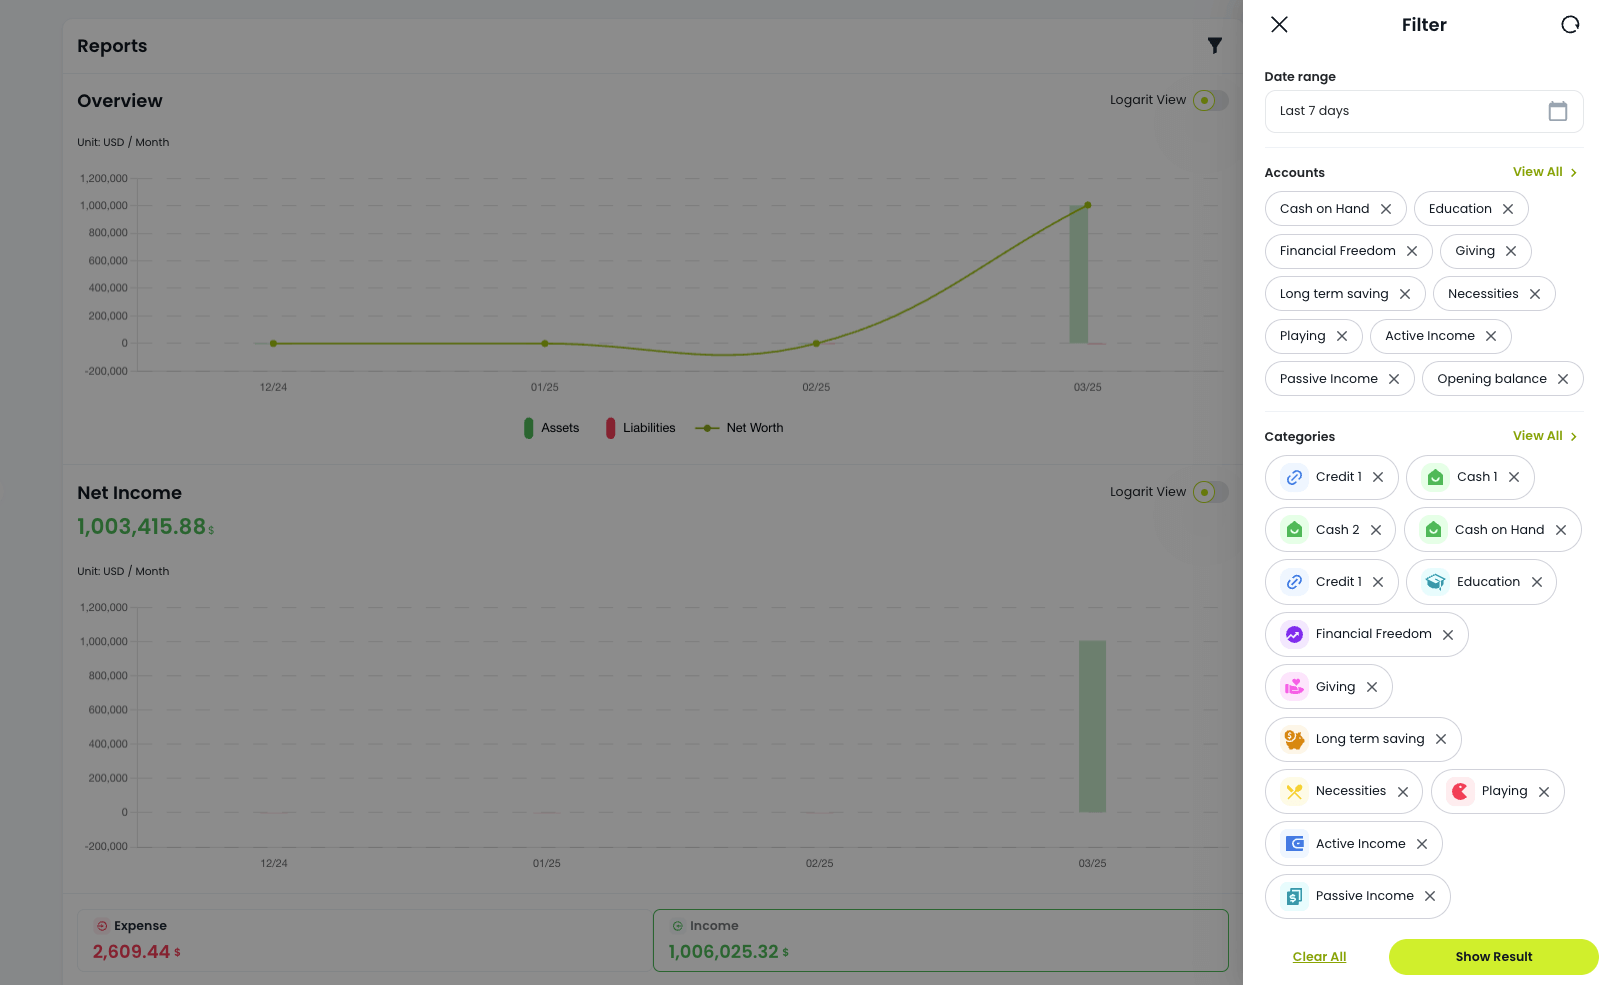
After selecting your desired filters, tap the Show Result green button to apply them.